Having been the proprietor of various financial websites for many years, I will admit that headlines about boring, sideways market action doesn't sell a lot of ads on the internet. However, the thinking is that big, bold, declarative headlines about new all-time highs for the stock market probably will, right?
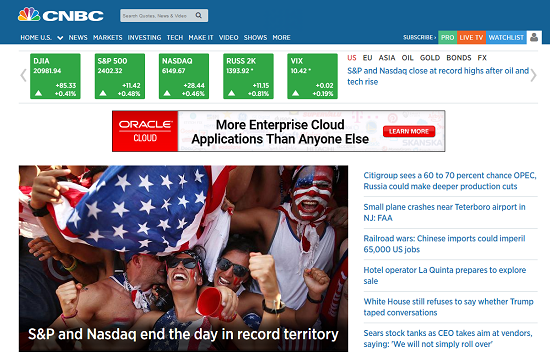
Apparently, this was what two of the biggest financial news sites were after yesterday as both CNBC.com and MarketWatch.com blared headlines touting what was purported to be a reason to celebrate.
Check out the screenshot below of CNBC.com's homepage yesterday, moments after the market closed. While I clearly missed the reason for the celebratory mood during my analysis of the action yesterday, it appears that the rest Wall Street is partying like its 1999 again!
Okay, I know that I can be hard on the popular financial press at times. But in all honesty, the first reaction I had when I saw this homepage pic was, "Wait, what?"
I guess if you don't watch the market on an intraday basis, the fact that the NASDAQ and the S&P 500 finished at new all-time highs might be a reason to smile. Especially when those new highs come in the face of political uncertainty and some disturbing geopolitical events in North Korea. Forget the worries, it's time to raise a glass and look up your 401K balance online.
I get it; eyeballs on the ads is the real game here - and as a publisher, it is your job to get people to click around a bit. But c'mon guys, in my humble opinion, this is getting ridiculous.
To get my point across, let's spend a couple minutes looking at some charts this morning. First up is the S&P 500, which to most investment pros "is" the market.
S&P 500 - Daily 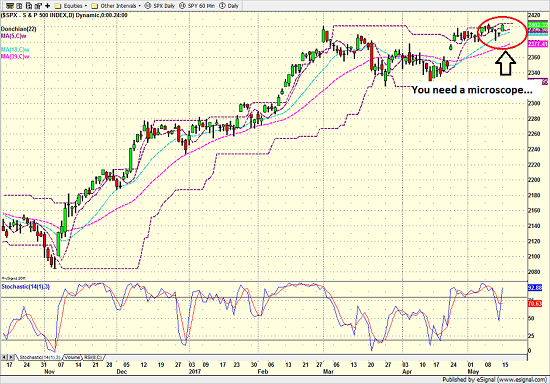
View Larger Image
Yes, it is true, that the S&P closed at a new record high yesterday, as the venerable blue-chip index exceeded the old high by 3 points - or 0.12%. However, the bottom line is you need to hit the zoom button several times to even see that the close was indeed a fresh record high.
To be sure, the hot action these days isn't in the blue chips. No, it's over on the NASDAQ where things are definitely getting giddy.
NASDAQ Composite - Daily 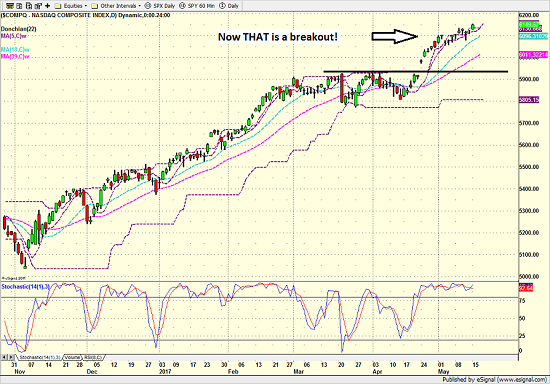
View Larger Image
In short, there is NOTHING to complain about here. And as I've opined a time or two lately, if the rest of the major indices can follow the NASDAQ's lead at some point soon, we will indeed have a reason to celebrate - and to check in on those account balances early and often.
But unfortunately, the chart of the NASDAQ is where the party ends these days in terms of the major market indices.
Take a quick peek at the charts of the Dow Jones Industrial Average, the Midcaps (as represented by the SPDR S&P 400 ETF - MDY), and the Smallcaps (i.e. the iShares Russell 2000 ETF - IWM).
Dow Jones Industrial Average - Daily 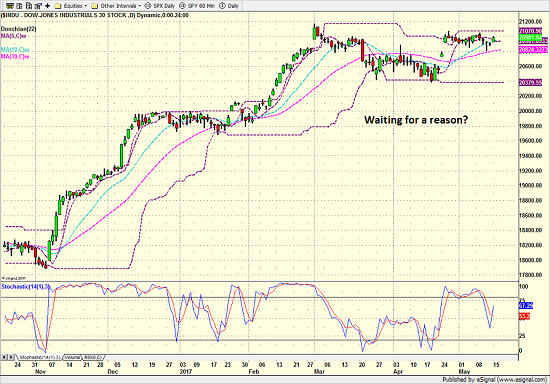
View Larger Image
SPDR S&P 400 Midcap ETF (MDY) - Daily 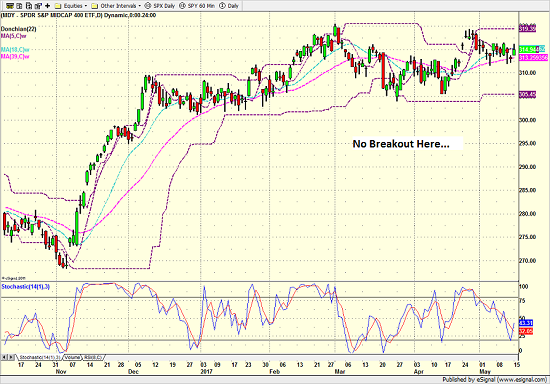
View Larger Image
iShares Russell 2000 ETF (IWM) - Daily 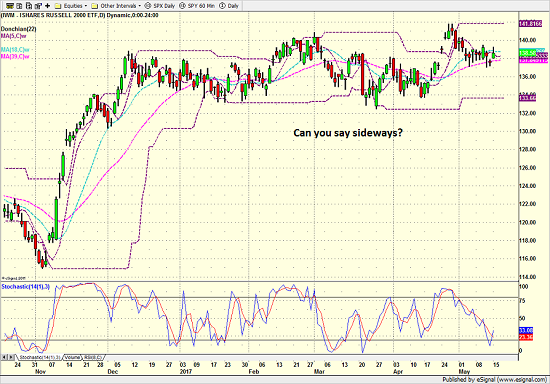
View Larger Image
For those of you keeping score at home, THIS is the reason that my major market models aren't in their happy places at the present time. THIS is an example of "narrow leadership." THIS is what a divergence looks like - a condition that tends to occur near the end of long bull markets. And THIS "can be" a problem - if it continues, that is.
The good news is that technical divergences such as we're seeing in the major indices can be resolved without incident over time. As such, the bulls have some room to work here and could right the ship with a little upside oomph in the near-term. However, the longer this type of divergence remains in place, the riskier the situation tends to become.
The good news is that technical divergences such as we're seeing in the major indices can be resolved without incident over time. As such, the bulls have some room to work here and could right the ship with a little upside oomph in the near-term. However, the longer this type of divergence remains in place, the riskier the situation tends to become.
So, while I hate to sound like a broken record, let's recognize that this is not a low-risk environment and that some caution might even be warranted in the near-term (i.e. the next several months).
At the same time though, let me reiterate that I believe any meaningful declines in the stock market would represent a buying opportunity within the context of an ongoing secular bull market trend. A trend that very well could last many years yet.
Publishing Note: My life is a little complicated for the next two weeks (my firm is hosting an advisor conference this week and then my wife and I are moving next week). Thus, I will publish morning reports as my schedule permits.
Thought For The Day:
A great fortune depends on luck, a small one on diligence. -Chinese Proverbs
Current Market Drivers
We strive to identify the driving forces behind the market action on a daily basis. The thinking is that if we can both identify and understand why stocks are doing what they are doing on a short-term basis; we are not likely to be surprised/blind-sided by a big move. Listed below are what we believe to be the driving forces of the current market (Listed in order of importance).
1. The State of Trump Administration Policies
2. The State of the U.S. Economy
3. The State of Earning Season
Wishing you green screens and all the best for a great day,

David D. Moenning
Chief Investment Officer
Sowell Management Services
Disclosure: At the time of publication, Mr. Moenning and/or Sowell Management Services held long positions in the following securities mentioned: none. Note that positions may change at any time.
Looking for a "Modern" approach to Asset Allocation and Portfolio Design?
Looking for More on the State of the Markets?
Disclosures
The opinions and forecasts expressed herein are those of Mr. David Moenning and may not actually come to pass. Mr. Moenning's opinions and viewpoints regarding the future of the markets should not be construed as recommendations. The analysis and information in this report is for informational purposes only. No part of the material presented in this report is intended as an investment recommendation or investment advice. Neither the information nor any opinion expressed constitutes a solicitation to purchase or sell securities or any investment program.
Any investment decisions must in all cases be made by the reader or by his or her investment adviser. Do NOT ever purchase any security without doing sufficient research. There is no guarantee that the investment objectives outlined will actually come to pass. All opinions expressed herein are subject to change without notice. Neither the editor, employees, nor any of their affiliates shall have any liability for any loss sustained by anyone who has relied on the information provided.
The analysis provided is based on both technical and fundamental research and is provided "as is" without warranty of any kind, either expressed or implied. Although the information contained is derived from sources which are believed to be reliable, they cannot be guaranteed.
David D. Moenning is an investment adviser representative of Sowell Management Services, a registered investment advisor. For a complete description of investment risks, fees and services, review the firm brochure (ADV Part 2) which is available by contacting Sowell. Sowell is not registered as a broker-dealer.
Employees and affiliates of Sowell may at times have positions in the securities referred to and may make purchases or sales of these securities while publications are in circulation. Positions may change at any time.
Investments in equities carry an inherent element of risk including the potential for significant loss of principal. Past performance is not an indication of future results.
Advisory services are offered through Sowell Management Services.
Recent free content from FrontRange Trading Co.
-
 Is The Bull Argument Too Easy These Days?
— 8/31/20
-
 What Do The Cycles Say About 2020?
— 1/21/20
-
 Modeling 2020 Expectations (Just For Fun)
— 1/13/20
-
 Tips From Real-World Wendy Rhoades
— 5/06/19
-
 The Best Recession Ever!
— 4/29/19
-
{[comment.author.username]} {[comment.author.username]} — Marketfy Staff — Maven — Member


