

Is The Bull Argument Too Easy These Days?
As a reminder, the market's primary cycles generally do not change often. However, I still like to start each week with a clear understanding of what type of market we are dealing with. For me, a quick glance at the color of the Primary Cycle board and the weekly/monthly S&P graphs below tells me an awful lot about the "state" of the key market cycles.
My Current Take...
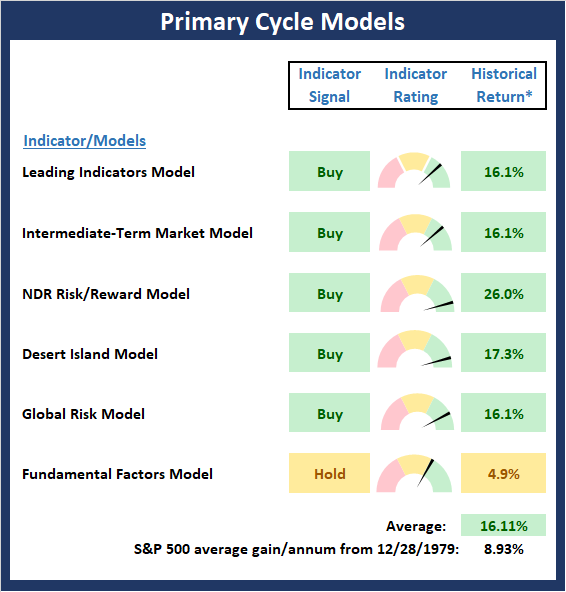
There are no changes to the Primary Cycle board this week. And with the board predominately green it is easy to argue that the bulls are large and in charge. But my biggest question/concern from a big-picture point of view is if the bullish argument is getting a little "too easy" to make these days!
View the Primary Cycle Model Board Online
* Source: Ned Davis Research (NDR) as of the date of publication. Historical returns are hypothetical average annual performances calculated by NDR. Past performances do not guarantee future results or profitability - NOT INDIVIDUAL INVESTMENT ADVICE.
Checking In On The "Primary" Cycles
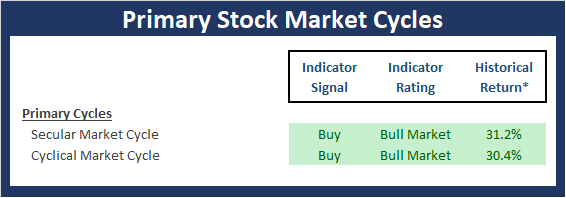
While I don't often make portfolio adjustments based on the long-term trends in the stock market (aka the "primary cycles"), I have found over the years that checking in on state of the cycles and the weekly/monthly charts helps to keep the big-picture in perspective.
View the Primary Cycles Board Online
* Source: Ned Davis Research (NDR) as of the date of publication. Historical returns are hypothetical average annual performances calculated by NDR. Past performances do not guarantee future results or profitability - NOT INDIVIDUAL INVESTMENT ADVICE.
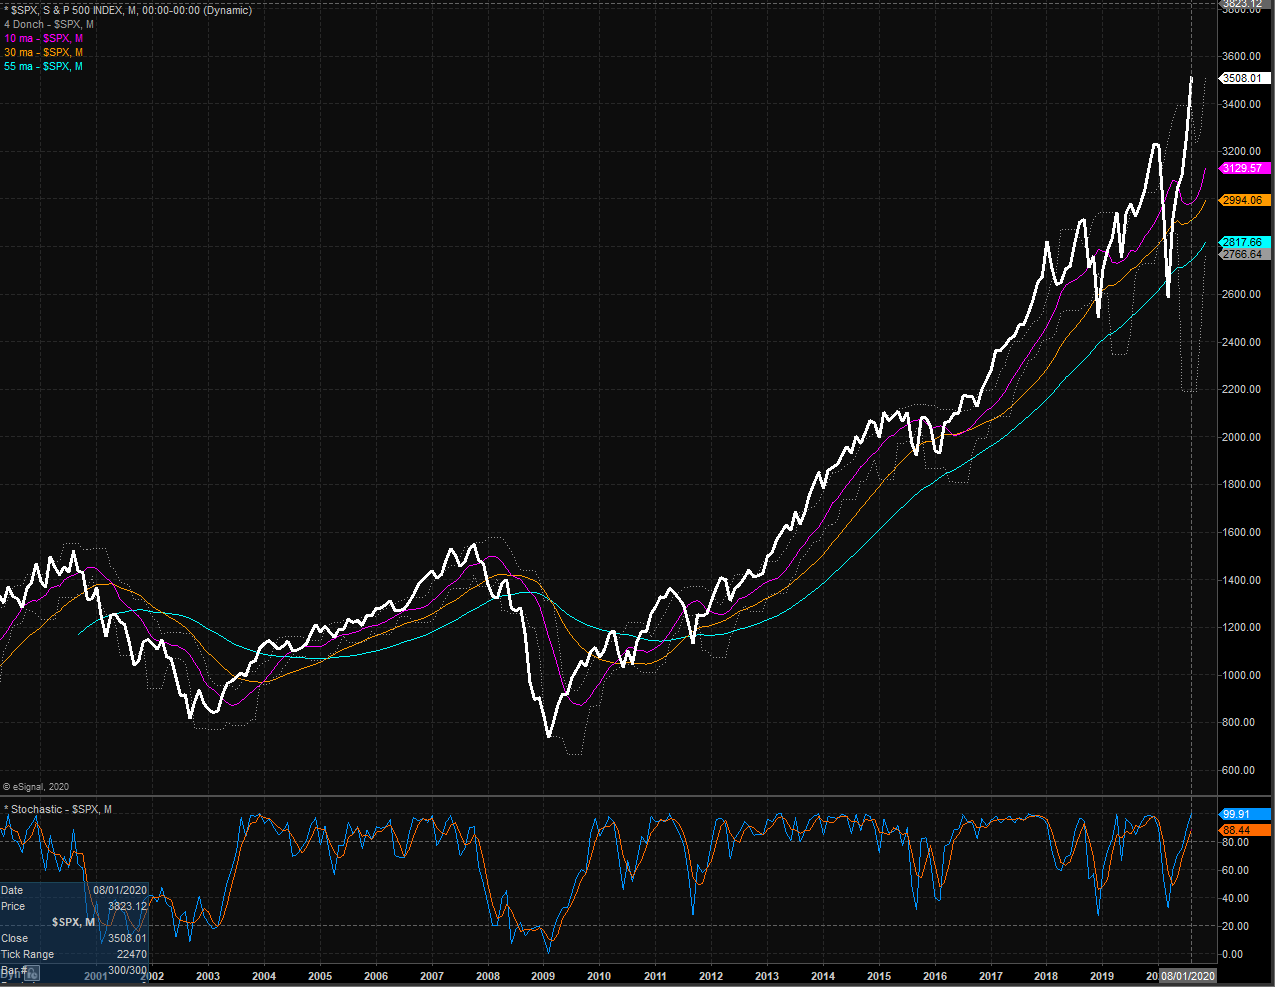
The Secular Market Cycle
Definition: A secular bull market is a period in which stock prices rise at an above-average rate for an extended period (think 5 years or longer) and suffer only relatively short intervening declines. A secular bear market is an extended period of flat or declining stock prices. Secular bull or bear markets typically consist of multiple cyclical bull and bear markets. Below is a monthly chart of the S&P 500 Index illustrating the current cycle, which we estimate began on March 9, 2009.
S&P 500 - Monthly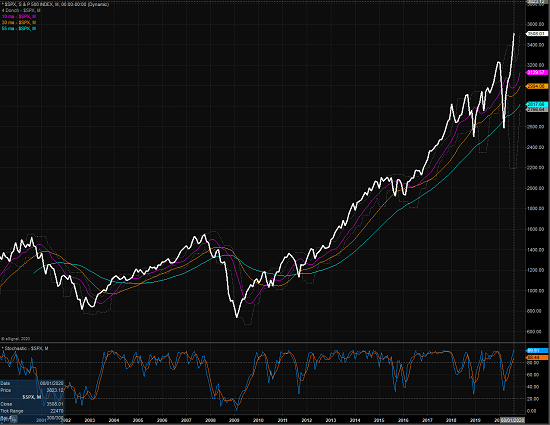
View Larger Chart Online
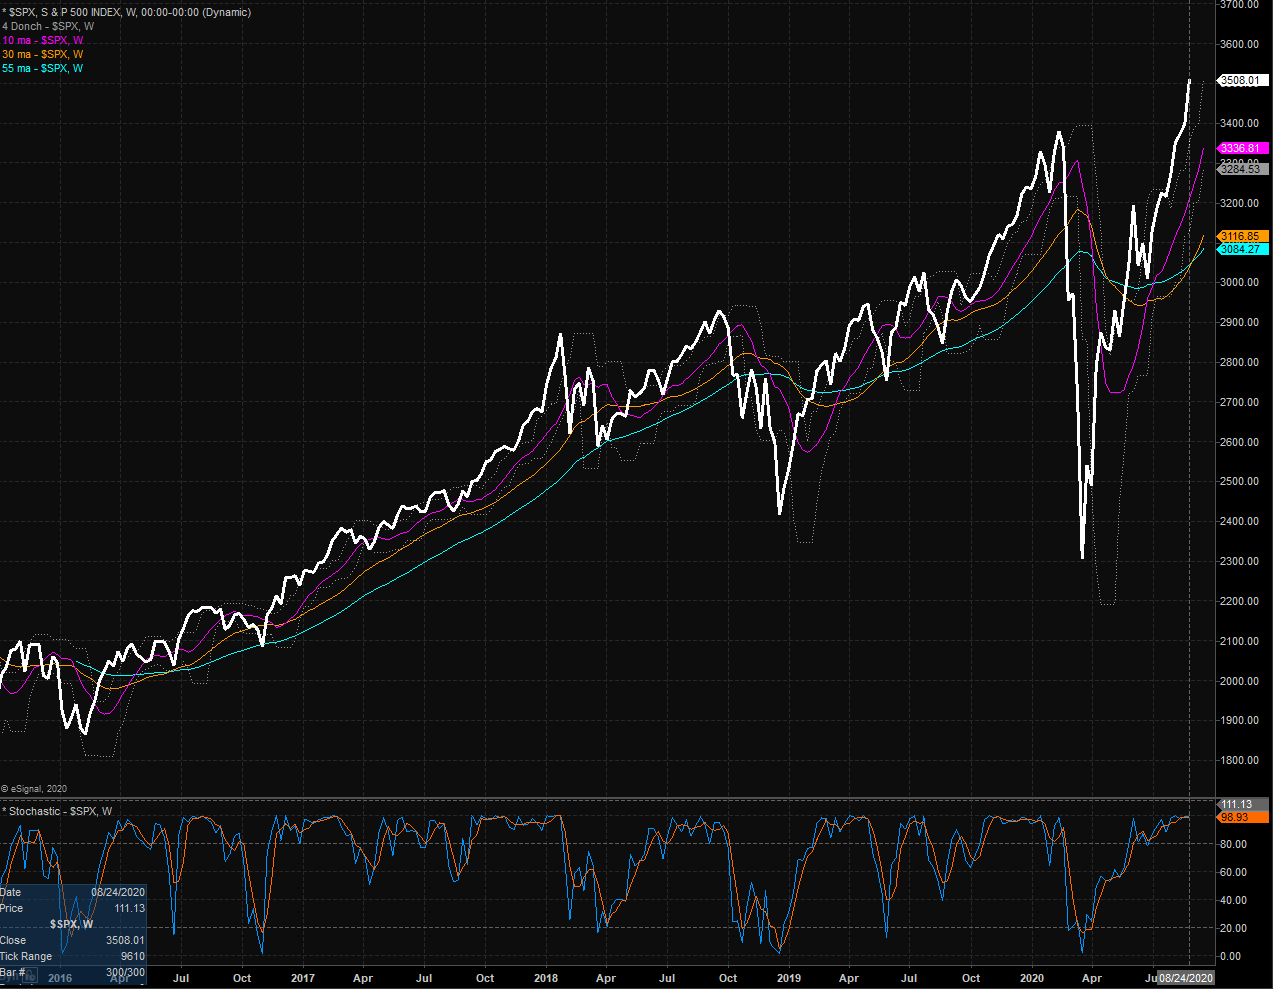
The Cyclical Market Cycle
Definition: A cyclical bull market requires a 30% rise in the DJIA after 50 calendar days or a 13% rise after 155 calendar days. Reversals of 30% in the Value Line Geometric Index since 1965 also qualify. A cyclical bear market requires a 30% drop in the DJIA after 50 calendar days or a 13% decline after 145 calendar days. Reversals of 30% in the Value Line Geometric Index also qualify. Below is a weekly chart of the S&P 500 illustrating the current cycle, which we estimate began on March 24, 2020.
S&P 500 - Weekly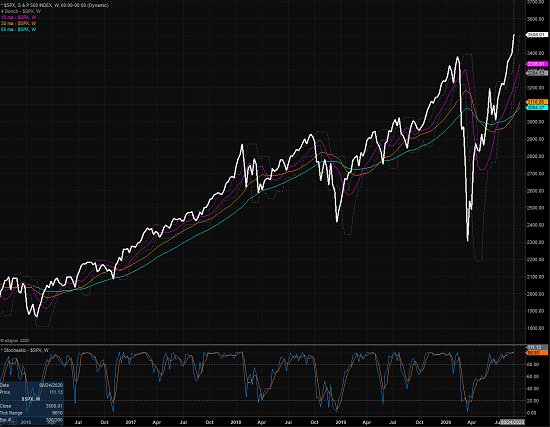
View Larger Chart Online
Summing Up
In summary, my key market models, which have been designed to tell me what type of big-picture market cycle we are dealing with - and models that I've been working with for many, many years - remain in good shape. However, from a near-term perspective, I worry that the "argument" to stick with the bulls is becoming a little too easy to make. Especially when everyone under the sun is now trading in their Robinhood accounts and looking for the next big score. As such, while the bulls remain in control of the game, some sort of pullback, correction, or consolidation phase would seem to make some sense in the coming weeks.
Thought For The Day:
Success is not counted by how high you have climbed but by how many people you brought with you. -Wil Rose
Primary Market Models Explained
Leading Indicators Model: A group of indicators that have historically shown tendencies to lead the market at major turning points.
Intermediate-Term Market Model: A composite model-of-models focused on trend and momentum indicators which has been designed to provide identify intermediate-term trading opportunities. The model includes 38 independent indicators covering price trends, volume, breadth, momentum, historical cycles, sentiment, and mean reversion.
Risk/Reward Model: A model-of-models designed to provide an overall view of the state of the risk/reward environment. The model includes tape, monetary, and sentiment indicators as well as 7 big-picture market model readings.
Desert Island Model: If I was stranded on a desert island with access to only one market model to manage money with, this would be the model. The model is a comprehensive model-of-models comprised of trend, momentum, mean reversion, economic, monetary, sentiment, and factor-based indicators/models.
Global Risk Model: A series of indicators designed to gauge the relative risk tolerance of the global investment environment.
Fundamental Factors Model: A model-of-models designed to provide a reading on the "macro state" of the environment. The model is comprised of indicators/models in the areas of monetary conditions, the economy, corporate earnings, inflation, and stock market valuation.
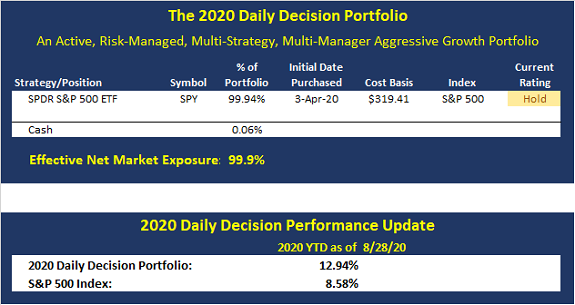
The ALL-NEW 2020 Daily Decision Model Portfolio
Current Positions and Performance Update
Below are the current positions for the 2020 Daily Decision Model Portfolio as well as an update on year-to-date performance through yesterday's close.
Take A Free Trial of the Daily Decision Service Today
About The Portfolio: The Daily Decision Model Portfolio is an aggressive, actively risk-managed, multi-strategy, multi-manager approach. The primary objective of the portfolio is to stay in tune with the major market cycles - both bull and bear. However, the portfolio will, at times, actively manage exposures based on shorter-term moves. In addition to "timing" moves, the portfolio will utilize levered positions via ETFs and may hold an effective net short position during negative cycles.
Strategy Diversification: The 2020 DD Portfolio utilizes a well diversified approach. The management strategy incorporates multiple trading strategies so as to avoid the "singular failure" problem that can occur when a single strategy is out of sync. There are a total of 9 different trading strategies working in the 2020 DD Portfolio. Three "turbo-charged" aggressive beta strategies. Three mean reversion strategies. And three risk-management strategies. In addition, there are three separate managers working in the portfolio.
An Actively Traded Approach: We anticipate the portfolio will trade 2-3 times a week and hold between two and four ETF positions. Finally, please note that the Daily Decision Portfolio strategy is aggressive in nature and thus, drawdowns can and will occur. However, we believe the strategy will rebound quickly after temporary pullbacks.
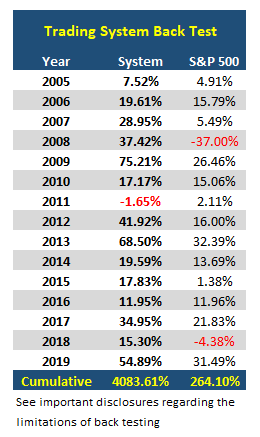
Testing The Trading Systems
In my humble opinion, it would be foolish to utilize any trading approach without first testing the strategy. However, when you combine strategies that have never been combined before, you have a hypothetical strategy. As such, you must do a back test on the combination.
There is a well known saying in the investment management business relating to hypothetical tests of trading systems that goes a little something like this: "Back tests are bull*#$!"
To be sure, there are problems involved with back testing, not the least of which is curve fitting. I.E. making your system fit the data provided. This is what happens when inexperienced traders try to develop systems that would have done well historically.
However, our approach here is different. We aren't using back testing to develop strategies to trade the market. No, we are testing a combination of EXISTING systems in effort to create "proof of concept." In other words, does a certain combination of systems developed by different managers work well together over time?
Take A Free Trial of the Daily Decision Service Today
Wishing You All The Best in Your Investing Endeavors!
The Front Range Trading Team
NOT INVESTMENT ADVICE. The analysis and information in this report and on our website is for informational purposes only. No part of the material presented in this report or on our websites is intended as an investment recommendation or investment advice. Neither the information nor any opinion expressed nor any Portfolio constitutes a solicitation to purchase or sell securities or any investment program. The opinions and forecasts expressed are those of the editors and may not actually come to pass. The opinions and viewpoints regarding the future of the markets should not be construed as recommendations of any specific security nor specific investment advice. Investors should always consult an investment professional before making any investment.
Important Disclosures Relating to the Limitations of Back Testing:
The preceding summary of hypothetical performance is for illustrative purposes only and is not a solicitation or recommendation of any investment strategy.
There is no guarantee that investment results portrayed in this illustration will yield similar future results. All investments and/or investment strategies involve risk including the possible loss of principal. Consult an investment professional before investing in any investment program.
In the illustration we have utilized hypothetical back testing to create the performance record to reflect the manner in which an account could be managed. Hypothetical back tested performance results have many inherent limitations and do not reflect the actual results of any client account.
Hypothetical performance results are achieved by means of the retroactive mixing of portfolio strategies that was designed and prepared with the benefit of hindsight. No representation is being made that any strategy will or is likely to achieve profits or have losses similar to those shown. Hypothetical testing may not reflect the impact that any material market or economic factor may have on investment decision making. Further, the performance record in this illustration may have under or over compensated for the impact, if any, of certain market factors (e.g. lack of liquidity, trading costs, etc.). The conditions, objectives or investment strategies may have changed materially during the time period, or after the time period, portrayed in this performance record, and the effect of such change is not portrayed in the performance record.
Hypothetical back tested performance results are shown gross of management fees. Hypothetical back tested performance results are before trading and other custodian costs and do not consider the impact of taxes.
PAST PERFORMANCE IS NOT NECESSARILY INDICATIVE OF FUTURE RESULTS
Recent free content from FrontRange Trading Co.
-
 What Do The Cycles Say About 2020?
— 1/21/20
What Do The Cycles Say About 2020?
— 1/21/20
-
Modeling 2020 Expectations (Just For Fun)
— 1/13/20
-
Tips From Real-World Wendy Rhoades
— 5/06/19
-
The Best Recession Ever!
— 4/29/19
-
Is "Melt-Up" The Operative Word?
— 4/22/19
