

Understanding the Current Earnings Game
When stocks enter a corrective phase, the main question investors tend to ask themselves is, has anything changed from a macro point of view?
One of the problems with trying to answer this question is that corrections generally are born out of a period of high confidence and/or complacency. A period where everyone knows the bullish case. A period where everyone is confident about the outlook. And a period where everyone "knows" what is going to happen next. Well, until something changes, that is.
The point is that when you are comfortable with your premise and everyone agrees with your view, seeing a change in the environment can be tough. Things are going well. Nobody wants anything to change. So, first understanding and then accepting the facts that (a) something is changing and (b) you may need to make adjustments to your portfolio strategy, can be challenging.
From my seat, we are seeing this type of scenario play out in the here and now. For example, one of the key fundamental drivers of the current bull market cycle has been robust corporate earnings. Make no mistake about it; earnings have been strong and have been consistently coming in above expectations. In fact, analysts project that EPS (earnings per share) growth for the S&P 500 will come in at 26.4% for calendar year 2018. Impressive.
Yet during the current earnings season, stocks have generally not been rewarded for their earnings/revenue "beats." Companies report earnings and revenues that are above expectations, management says good things about the business, and the stock proceeds to decline. What gives?
Heading The Wrong Direction
Besides the obvious worries about the impact of tariffs and rising rates, there appears to be something bigger at work here. As in, this may be as good as it gets on the earnings growth front for a while. And historically, this has been a problem.
Before we get to the numbers, it is vital to keep in mind that the stock market is a discounting mechanism of future expectations. We can argue until the cows come home about how far down the road the market tends to look. But the bottom line here is that the rate of earnings growth is going to slow in 2019. A lot.
Here's the math. For calendar year 2018, EPS for the S&P is expected to $157.38. For 2019, that number is projected to be $176.36, which is an increase of 12.07%. As such, the bulls can be heard telling folks that stocks can go higher because earnings are still movin' on up. And if earnings grow by 12%, it is logical that the major indices could climb at least at a similar rate.
But there are a couple problems with this thinking. First, the law of large numbers tells us that the current gangbuster earning growth rate is unsustainable (with 47% of the S&P 500 companies reporting, Q3 earnings are currently running at 29.3% above year ago levels). And second, a large part of the current earnings growth can be attributed to the tax stimulus bill, which won't be repeated.
Yes, It Is Counterintuitive, But...
The key point to understand is that while it may sound completely counterintuitive, the stock market tends to struggle when (a) earnings growth is high and (b) the rate of earnings growth decelerates.
According to Ned Davis Research, when annual EPS for the S&P 500 exceeds 20%, the gain per annum of the index since 1927 has been... wait for it... +2.64%. Compare this to the average return of +6.01% for the entire period and the annualized gain of +12.1% when year-over-year EPS growth is between +5% and -20%. Hmmm...
Here's the way this works. Since stocks are always looking ahead, the best returns occur after a downturn as the market begins to "discount" better days ahead. Conversely, by the time the anticipated strong earnings numbers actually show up, the good numbers have already been priced in and the market proceeds to look ahead and "discount" the future.
Looking at the rate of growth in EPS, NDR's computers tell us that when earnings growth begins to decelerate, returns have been subpar. And with the rate of growth that is currently expected, the S&P has averaged just 3.3% since 1928. Super.
More Bad News
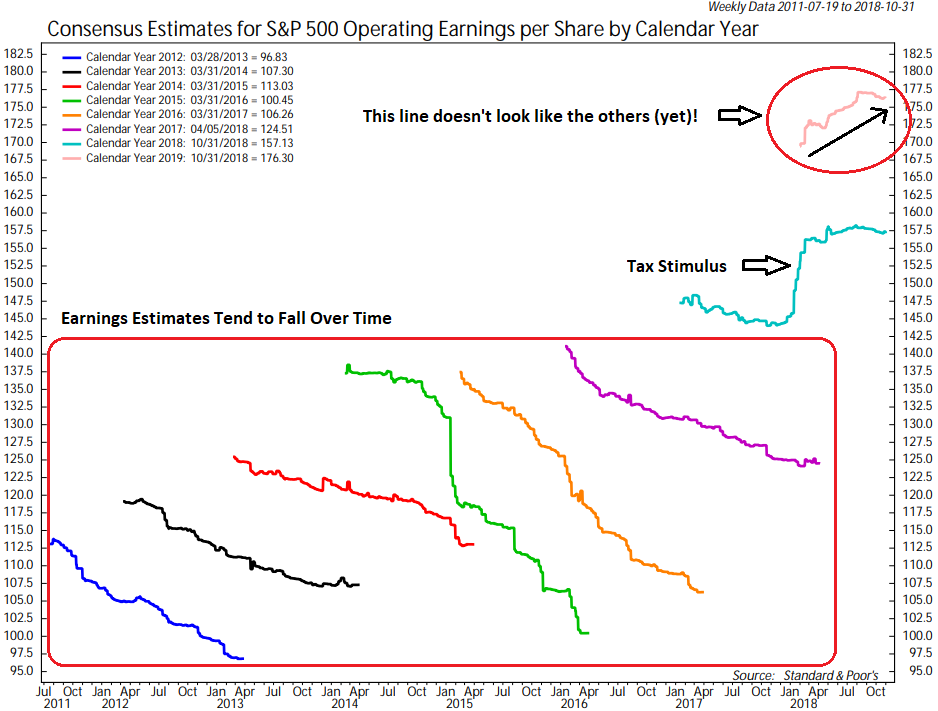
Unfortunately, there is one more aspect of this analysis that tends to lean the bear camp's way. You see, analyst estimates for the coming year's earnings typically start out too high and then fall over time. This is illustrated on the chart below from Ned Davis Research. The squiggly lines within the red box at the bottom represent the progression of the consensus estimates for S&P 500 EPS over time.
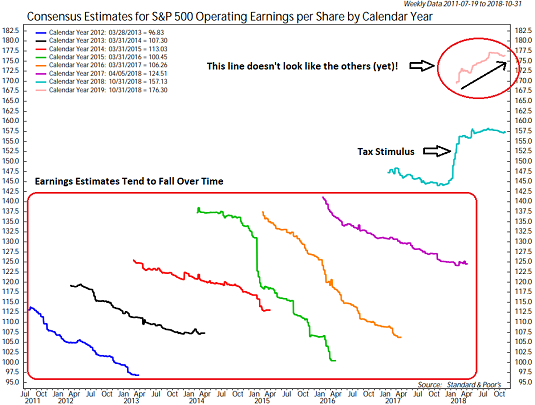
You will note that from 2012 through 2016, the squiggly lines all move down and to the right. This means that as time goes on, estimates tend to move lower. Until 2018 and 2019, that is.
The teal line that looks different from the rest is 2018's case. As usual, the line began moving down and to the right. But then the tax bill got passed. Bam - earnings estimates went up.
Now look at line in the upper right. This is the consensus estimate for 2019. This line also doesn't look like the others. Instead of moving down and to the right, it is moving up and to the right. This means that analysts have been increasing their estimates for next year.
Will This Time Be Different?
This would seem to suggest that "this time it's different." But as most investors know, betting on those four words tends to be a death knell for portfolio performance.
So, will this time indeed be different? Or will earnings estimates start to come down due to stuff like, oh, I don't know; slowing economic growth, tariffs, supply chain disruptions, rising prices, rising rates, geopolitical issues, and/or rising inflation. Again, hmmm....
The Takeaway
My takeaway from this analysis is that it is important to understand how the stock market game is played. So, for starters, as the saying goes, something that everybody already knows (in this case, strong earnings) isn't worth knowing - because it's already priced into the market.
But what most folks don't know is that the RATE of earnings growth is also very important. And with the current growth rate in the unsustainable zone and falling, this combination has historically been, at the very least, a headwind for stocks.
The good news is that stocks are currently entrenched in a corrective phase. This means the market very well could be "discounting" the declining rate of earnings growth as well as the various potential potholes that may appear on the road ahead.
It is also good news that Wall Street traders tend to overdo EVERYTHING! As such, it is safe to assume that if pessimism about the future takes root, it too will be overdone in time. This could lead to earnings expectations being too low, which could, of course, produce the type of "upside surprises" that tend to create strong and sustainable rallies.
But for now, it appears that investors are a bit concerned about the current earnings game.
Moving On... Now let's turn to the weekly review of my favorite indicators and market models...
The State of the Big-Picture Market Models
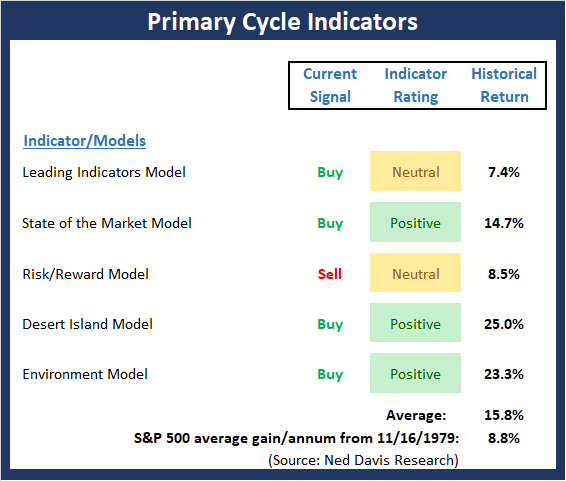
I like to start each week with a review of the state of my favorite big-picture market models, which are designed to help me determine which team is in control of the primary trend.
View My Favorite Market Models Online
The Bottom Line:
-
The key takeaway from the Primary Cycle board is simple. The secular bull remains intact.
This week's mean percentage score of my 5 favorite models improved to 72.5 (from 63.5%) while the median was unchanged at 75%. And as I pointed out last week, it is worth noting that the historical return of the S&P 500 with the current model readings is strong and well above the average.
The State of the Trend
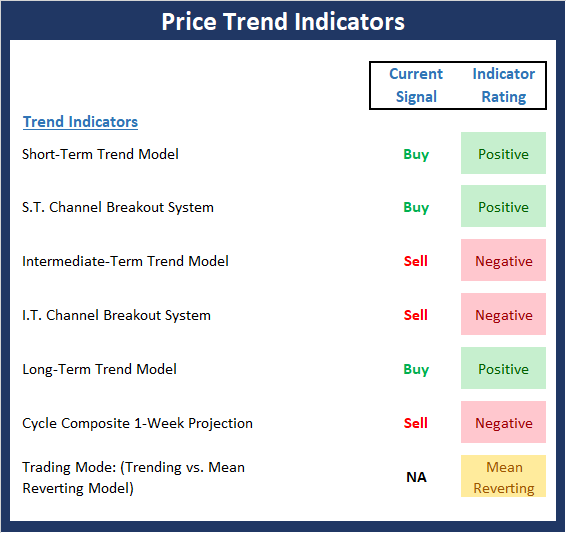
Once I've reviewed the big picture, I then turn to the "state of the trend." These indicators are designed to give us a feel for the overall health of the current short- and intermediate-term trend models.
View Trend Indicator Board Online
The Bottom Line:
- Not much change to the Trend board this week. The question of the day remains if we are seeing a dead cat bounce play out or a resumption of the uptrend. The odds would favor a bottoming process at this stage. As such, we should look for a retest phase in the near-term. However, a break above last weeks' high would likely turn the tables and embolden the bulls into year end.
The State of Internal Momentum
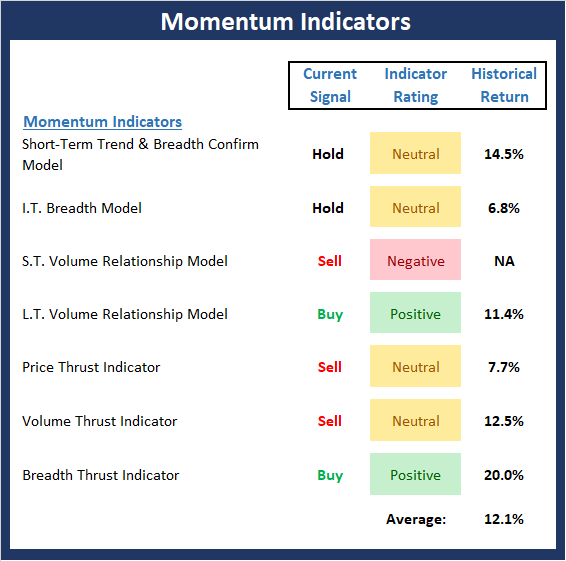
Next up are the momentum indicators, which are designed to tell us whether there is any "oomph" behind the current trend.
View Momentum Indicator Board Online
The Bottom Line:
- There is more good news to report on the momentum front this week. First, our I.T. Breadth Model, which had been very close to issuing an important sell signal, improved a bit more last week. Next, the Price Thrust indicator, which had fallen into the "it's so bad, it's good" zone has now reversed into the neutral zone. Finally, the Breadth Thrust indicator on the NASDAQ has flashed a buy signal and is now positive.
The State of the "Trade"
We also focus each week on the "early warning" board, which is designed to indicate when traders might start to "go the other way" -- for a trade.

View Early Warning Indicator Board Online
The Bottom Line:
- After providing a strong indication that stocks were oversold and due to bounce, the "Early Warning" board is now starting to edge toward another "warning" - this time favoring the bears. However, the board is not there yet and still suggests the bulls can maintain control.
The State of the Macro Picture
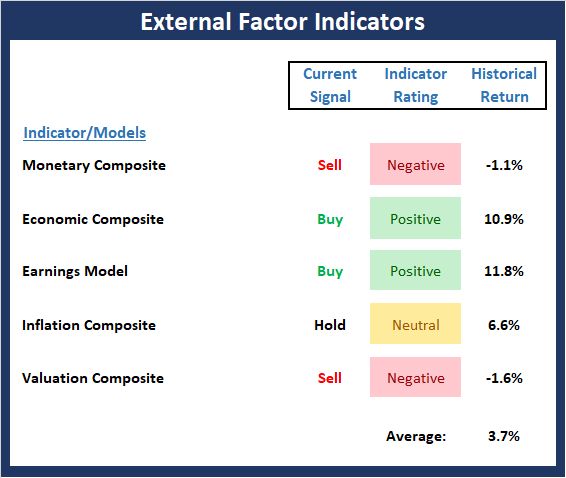
Now let's move on to the market's "environmental factors" - the indicators designed to tell us the state of the big-picture market drivers including monetary conditions, the economy, inflation, and valuations.
View Environment Indicator Board Online
The Bottom Line:
- There are no changes to the External Factors board this week. While I apologize for continuing to sing the same song here each week, the takeaway from this board is that risk factors remain elevated.
Thought For The Day:
You are what your record says you are. -Bill Belichick
Wishing you green screens and all the best for a great day,

David D. Moenning
Founder, Chief Investment Officer
Heritage Capital Research
HCR Focuses on a Risk-Managed Approach to Investing
What Risk Management Can and Cannot Do

ANNOUNCEMENT:
HCR Awarded Top Honors in 2018 NAAIM Shark Tank Portfolio Strategy Competition
Each year, NAAIM (National Association of Active Investment Managers) hosts a competition to identify the best actively managed investment strategies. In April, HCR's Dave Moenning took home first place for his flagship risk management strategy.
<hr>Disclosures
At the time of publication, Mr. Moenning held long positions in the following securities mentioned: none - Note that positions may change at any time.
Indicators Explained
Short-Term Trend-and-Breadth Signal Explained: History shows the most reliable market moves tend to occur when the breadth indices are in gear with the major market averages. When the breadth measures diverge, investors should take note that a trend reversal may be at hand. This indicator incorporates NDR's All-Cap Dollar Weighted Equity Series and A/D Line. From 1998, when the A/D line is above its 5-day smoothing and the All-Cap Equal Weighted Equity Series is above its 25-day smoothing, the equity index has gained at a rate of +32.5% per year. When one of the indicators is above its smoothing, the equity index has gained at a rate of +13.3% per year. And when both are below, the equity index has lost +23.6% per year.
Channel Breakout System Explained: The short-term and intermediate-term Channel Breakout Systems are modified versions of the Donchian Channel indicator. According to Wikipedia, "The Donchian channel is an indicator used in market trading developed by Richard Donchian. It is formed by taking the highest high and the lowest low of the last n periods. The area between the high and the low is the channel for the period chosen."
Intermediate-Term Trend-and-Breadth Signal Explained: This indicator incorporates NDR's All-Cap Dollar Weighted Equity Series and A/D Line. From 1998, when the A/D line is above its 45-day smoothing and the All-Cap Equal Weighted Equity Series is above its 45-day smoothing, the equity index has gained at a rate of +17.6% per year. When one of the indicators is above its smoothing, the equity index has gained at a rate of +6.5% per year. And when both are below, the equity index has lost -1.3% per year.
Cycle Composite Projections: The cycle composite combines the 1-year Seasonal, 4-year Presidential, and 10-year Decennial cycles. The indicator reading shown uses the cycle projection for the upcoming week.
Trading Mode Indicator: This indicator attempts to identify whether the current trading environment is "trending" or "mean reverting." The indicator takes the composite reading of the Efficiency Ratio, the Average Correlation Coefficient, and Trend Strength models.
Volume Relationship Models: These models review the relationship between "supply" and "demand" volume over the short- and intermediate-term time frames.
Price Thrust Model Explained: This indicator measures the 3-day rate of change of the Value Line Composite relative to the standard deviation of the 30-day average. When the Value Line's 3-day rate of change have moved above 0.5 standard deviation of the 30-day average ROC, a "thrust" occurs and since 2000, the Value Line Composite has gained ground at a rate of +20.6% per year. When the indicator is below 0.5 standard deviation of the 30-day, the Value Line has lost ground at a rate of -10.0% per year. And when neutral, the Value Line has gained at a rate of +5.9% per year.
Volume Thrust Model Explained: This indicator uses NASDAQ volume data to indicate bullish and bearish conditions for the NASDAQ Composite Index. The indicator plots the ratio of the 10-day total of NASDAQ daily advancing volume (i.e., the total volume traded in stocks which rose in price each day) to the 10-day total of daily declining volume (volume traded in stocks which fell each day). This ratio indicates when advancing stocks are attracting the majority of the volume (readings above 1.0) and when declining stocks are seeing the heaviest trading (readings below 1.0). This indicator thus supports the case that a rising market supported by heavier volume in the advancing issues tends to be the most bullish condition, while a declining market with downside volume dominating confirms bearish conditions. When in a positive mode, the NASDAQ Composite has gained at a rate of +38.3% per year, When neutral, the NASDAQ has gained at a rate of +13.3% per year. And when negative, the NASDAQ has lost at a rate of -11.10% per year.
Breadth Thrust Model Explained: This indicator uses the number of NASDAQ-listed stocks advancing and declining to indicate bullish or bearish breadth conditions for the NASDAQ Composite. The indicator plots the ratio of the 10-day total of the number of stocks rising on the NASDAQ each day to the 10-day total of the number of stocks declining each day. Using 10-day totals smooths the random daily fluctuations and gives indications on an intermediate-term basis. As expected, the NASDAQ Composite performs much better when the 10-day A/D ratio is high (strong breadth) and worse when the indicator is in its lower mode (weak breadth). The most bullish conditions for the NASDAQ when the 10-day A/D indicator is not only high, but has recently posted an extreme high reading and thus indicated a thrust of upside momentum. Bearish conditions are confirmed when the indicator is low and has recently signaled a downside breadth thrust. In positive mode, the NASDAQ has gained at a rate of +22.1% per year since 1981. In a neutral mode, the NASDAQ has gained at a rate of +14.5% per year. And when in a negative mode, the NASDAQ has lost at a rate of -6.4% per year.
Short-Term Overbought/sold Indicator: This indicator is the current reading of the 14,1,3 stochastic oscillator. When the oscillator is above 80 and the %K is above the %D, the indicator gives an overbought reading. Conversely, when the oscillator is below 20 and %K is below its %D, the indicator is oversold.
Intermediate-Term Overbought/sold Indicator: This indicator is a 40-day RSI reading. When above 57.5, the indicator is considered overbought and when below 45 it is oversold.
Mean Reversion Model: This is a diffusion model consisting of five indicators that can produce buy and sell signals based on overbought/sold conditions.
VIX Indicator: This indicator looks at the current reading of the VIX relative to standard deviation bands. When the indicator reaches an extreme reading in either direction, it is an indication that a market trend could reverse in the near-term.
Short-Term Sentiment Indicator: This is a model-of-models composed of 18 independent sentiment indicators designed to indicate when market sentiment has reached an extreme from a short-term perspective. Historical analysis indicates that the stock market's best gains come after an environment has become extremely negative from a sentiment standpoint. Conversely, when sentiment becomes extremely positive, market returns have been subpar.
Intermediate-Term Sentiment Indicator: This is a model-of-models composed of 7 independent sentiment indicators designed to indicate when market sentiment has reached an extreme from an intermediate-term perspective. Historical analysis indicates that the stock market's best gains come after an environment has become extremely negative from a sentiment standpoint. Conversely, when sentiment becomes extremely positive, market returns have been subpar.
Long-Term Sentiment Indicator: This is a model-of-models composed of 6 independent sentiment indicators designed to indicate when market sentiment has reached an extreme from a long-term perspective. Historical analysis indicates that the stock market's best gains come after an environment has become extremely negative from a sentiment standpoint. Conversely, when sentiment becomes extremely positive, market returns have been subpar.
Absolute Monetary Model Explained: The popular cliché, "Don't fight the Fed" is really a testament to the profound impact that interest rates and Fed policy have on the market. It is a proven fact that monetary conditions are one of the most powerful influences on the direction of stock prices. The Absolute Monetary Model looks at the current level of interest rates relative to historical levels and Fed policy.
Relative Monetary Model Explained: The "relative" monetary model looks at monetary indicators relative to recent levels as well as rates of change and Fed Policy.
Economic Model Explained: During the middle of bull and bear markets, understanding the overall health of the economy and how it impacts the stock market is one of the few truly logical aspects of the stock market. When our Economic model sports a "positive" reading, history (beginning in 1965) shows that stocks enjoy returns in excess of 21% per year. Yet, when the model's reading falls into the "negative" zone, the S&P has lost nearly -25% per year. However, it is vital to understand that there are times when good economic news is actually bad for stocks and vice versa. Thus, the Economic model can help investors stay in tune with where we are in the overall economic cycle.
Inflation Model Explained: They say that "the tape tells all." However, one of the best "big picture" indicators of what the market is expected to do next is inflation. Simply put, since 1962, when the model indicates that inflationary pressures are strong, stocks have lost ground. Yet, when inflationary pressures are low, the S&P 500 has gained ground at a rate in excess of 13%. The bottom line is inflation is one of the primary drivers of stock market returns.
Valuation Model Explained: If you want to get analysts really riled up, you need only to begin a discussion of market valuation. While the question of whether stocks are overvalued or undervalued appears to be a simple one, the subject is extremely complex. To simplify the subject dramatically, investors must first determine if they should focus on relative valuation (which include the current level of interest rates) or absolute valuation measures (the more traditional readings of Price/Earnings, Price/Dividend, and Price/Book Value). We believe that it is important to recognize that environments change. And as such, the market's focus and corresponding view of valuations are likely to change as well. Thus, we depend on our Valuation Models to help us keep our eye on the ball.
<hr>Disclosures
The opinions and forecasts expressed herein are those of Mr. David Moenning and may not actually come to pass. Mr. Moenning's opinions and viewpoints regarding the future of the markets should not be construed as recommendations. The analysis and information in this report is for informational purposes only. No part of the material presented in this report is intended as an investment recommendation or investment advice. Neither the information nor any opinion expressed constitutes a solicitation to purchase or sell securities or any investment program.
Any investment decisions must in all cases be made by the reader or by his or her investment adviser. Do NOT ever purchase any security without doing sufficient research. There is no guarantee that the investment objectives outlined will actually come to pass. All opinions expressed herein are subject to change without notice. Neither the editor, employees, nor any of their affiliates shall have any liability for any loss sustained by anyone who has relied on the information provided.
Mr. Moenning may at times have positions in the securities referred to and may make purchases or sales of these securities while publications are in circulation. Positions may change at any time.
The analysis provided is based on both technical and fundamental research and is provided "as is" without warranty of any kind, either expressed or implied. Although the information contained is derived from sources which are believed to be reliable, they cannot be guaranteed.
Investments in equities carry an inherent element of risk including the potential for significant loss of principal. Past performance is not an indication of future results.
Recent free content from FrontRange Trading Co.
-
 Is The Bull Argument Too Easy These Days?
— 8/31/20
Is The Bull Argument Too Easy These Days?
— 8/31/20
-
What Do The Cycles Say About 2020?
— 1/21/20
-
Modeling 2020 Expectations (Just For Fun)
— 1/13/20
-
Tips From Real-World Wendy Rhoades
— 5/06/19
-
The Best Recession Ever!
— 4/29/19
